Interactive Tableau Dashboard
Comprehensive dashboard with interactive filters and visualizations for exploring wealth distribution across nations

Interactive dashboard with Excel & Tableau
An interactive dashboard that analyzes the wealth distribution and economic indicators across different nations. Built using Excel for data preprocessing and Tableau for advanced visualization, this project provides insights into global economic patterns and trends.
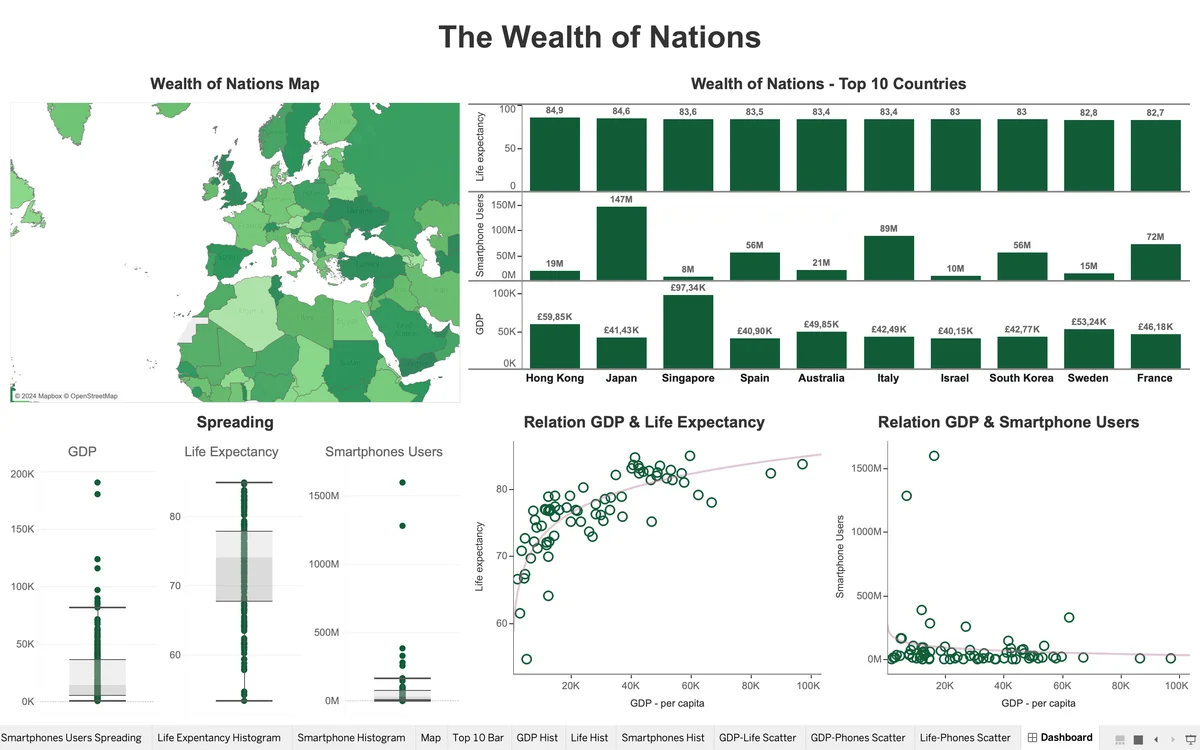
Comprehensive dashboard with interactive filters and visualizations for exploring wealth distribution across nations
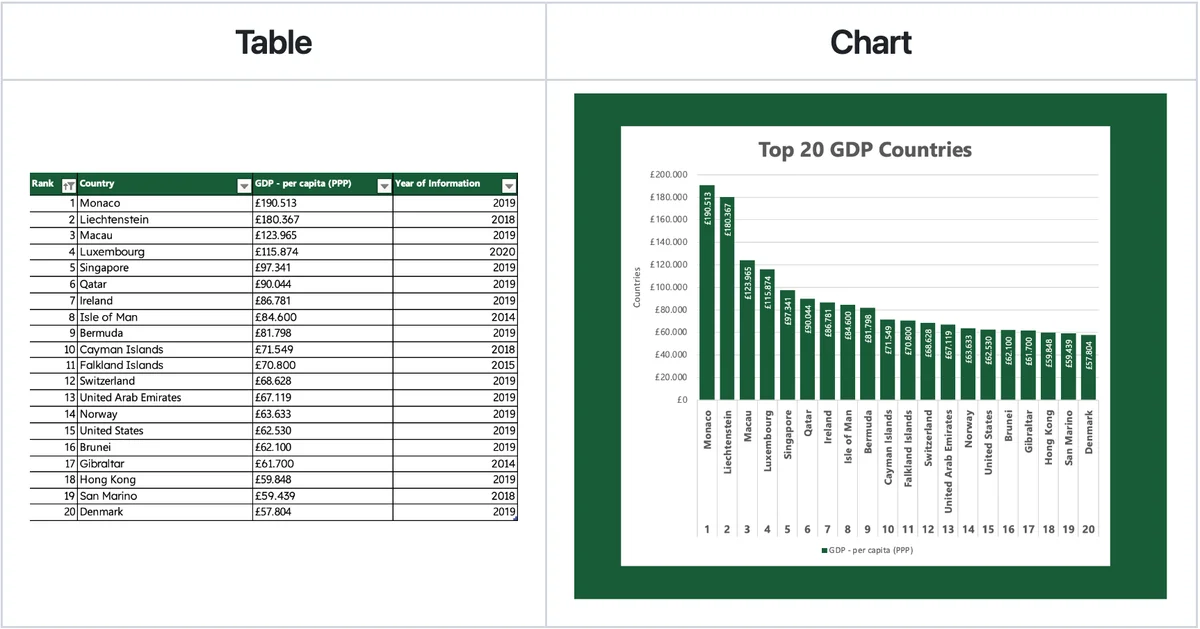
Advanced Excel techniques for data cleaning, transformation, and preparation for visualization
Analysis of key economic metrics including GDP, population, and wealth per capita across different countries
Visual representation of economic trends and patterns to identify insights in global wealth distribution
The Wealth of Nations dashboard successfully demonstrates the power of combining Excel's data manipulation capabilities with Tableau's visualization features. This project provides valuable insights into global economic patterns and showcases proficiency in business intelligence tools for data analysis and presentation.